 FRACTAL FIND
FRACTAL EXPERIMENTAL FIGURES
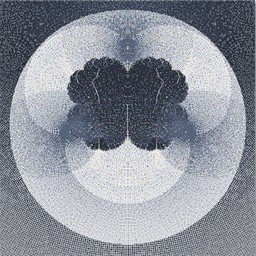
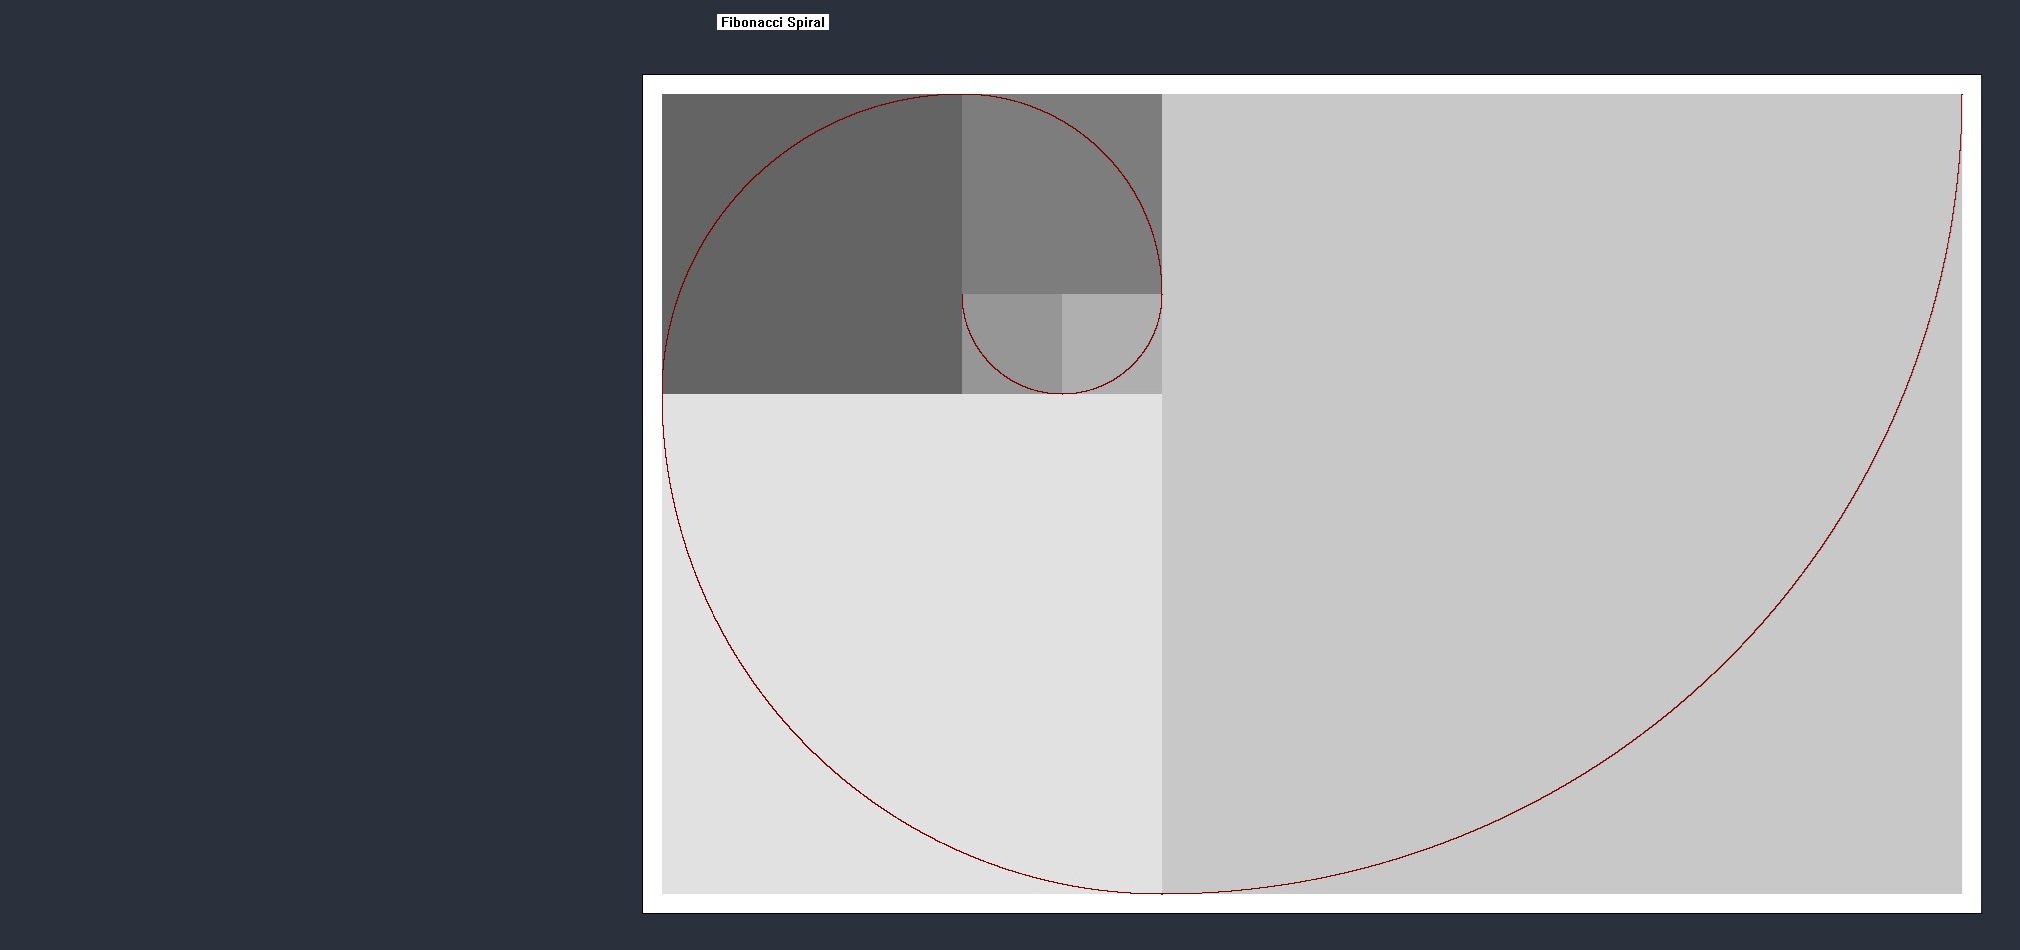
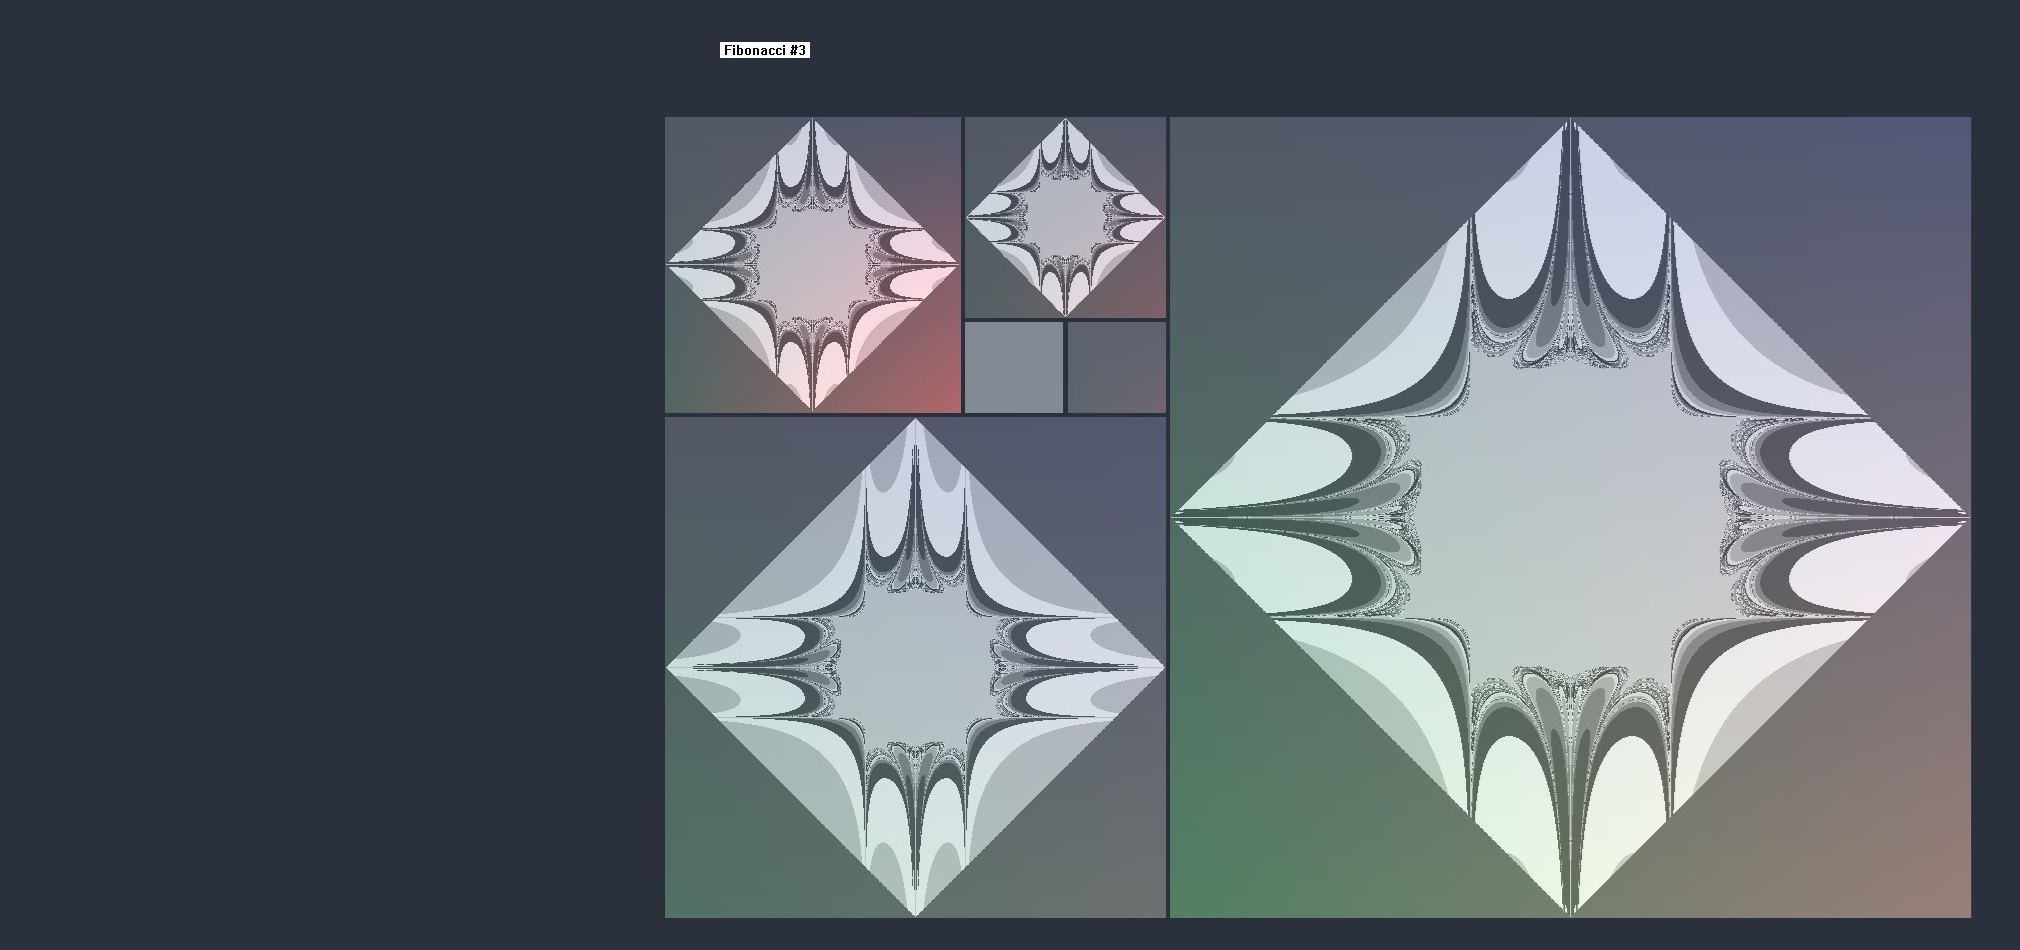
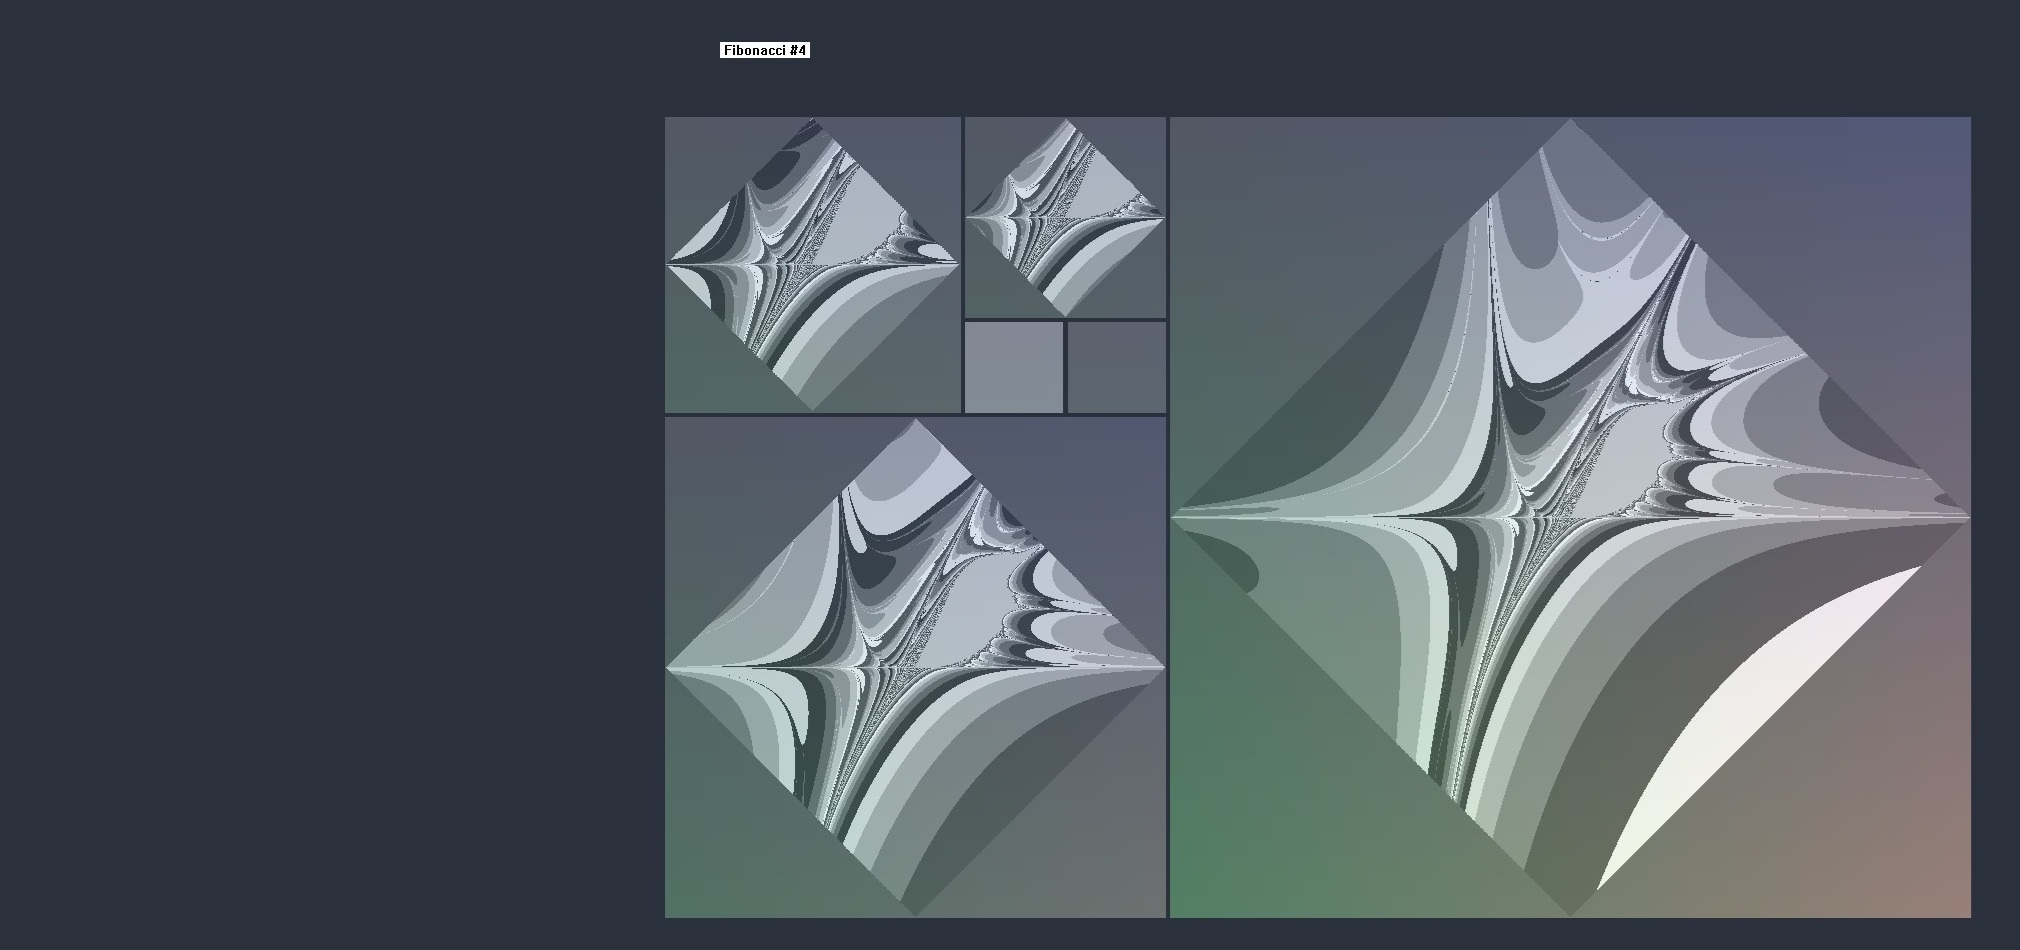
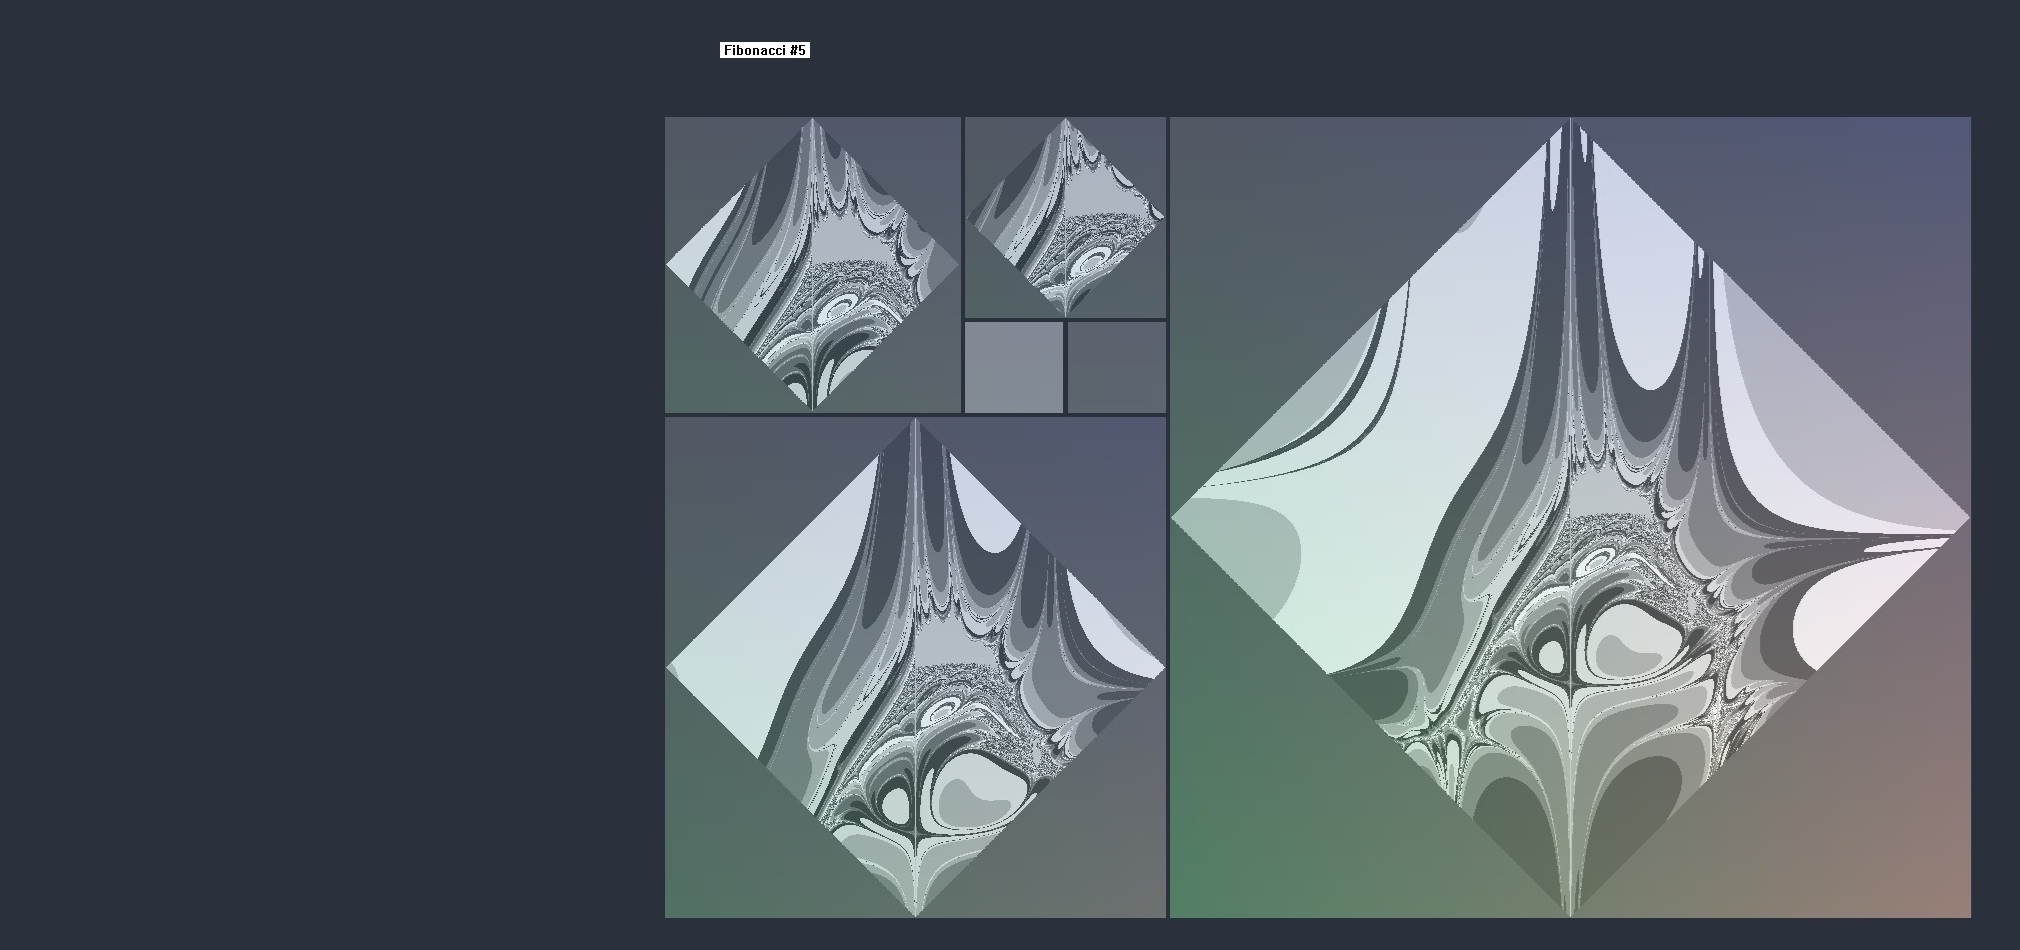
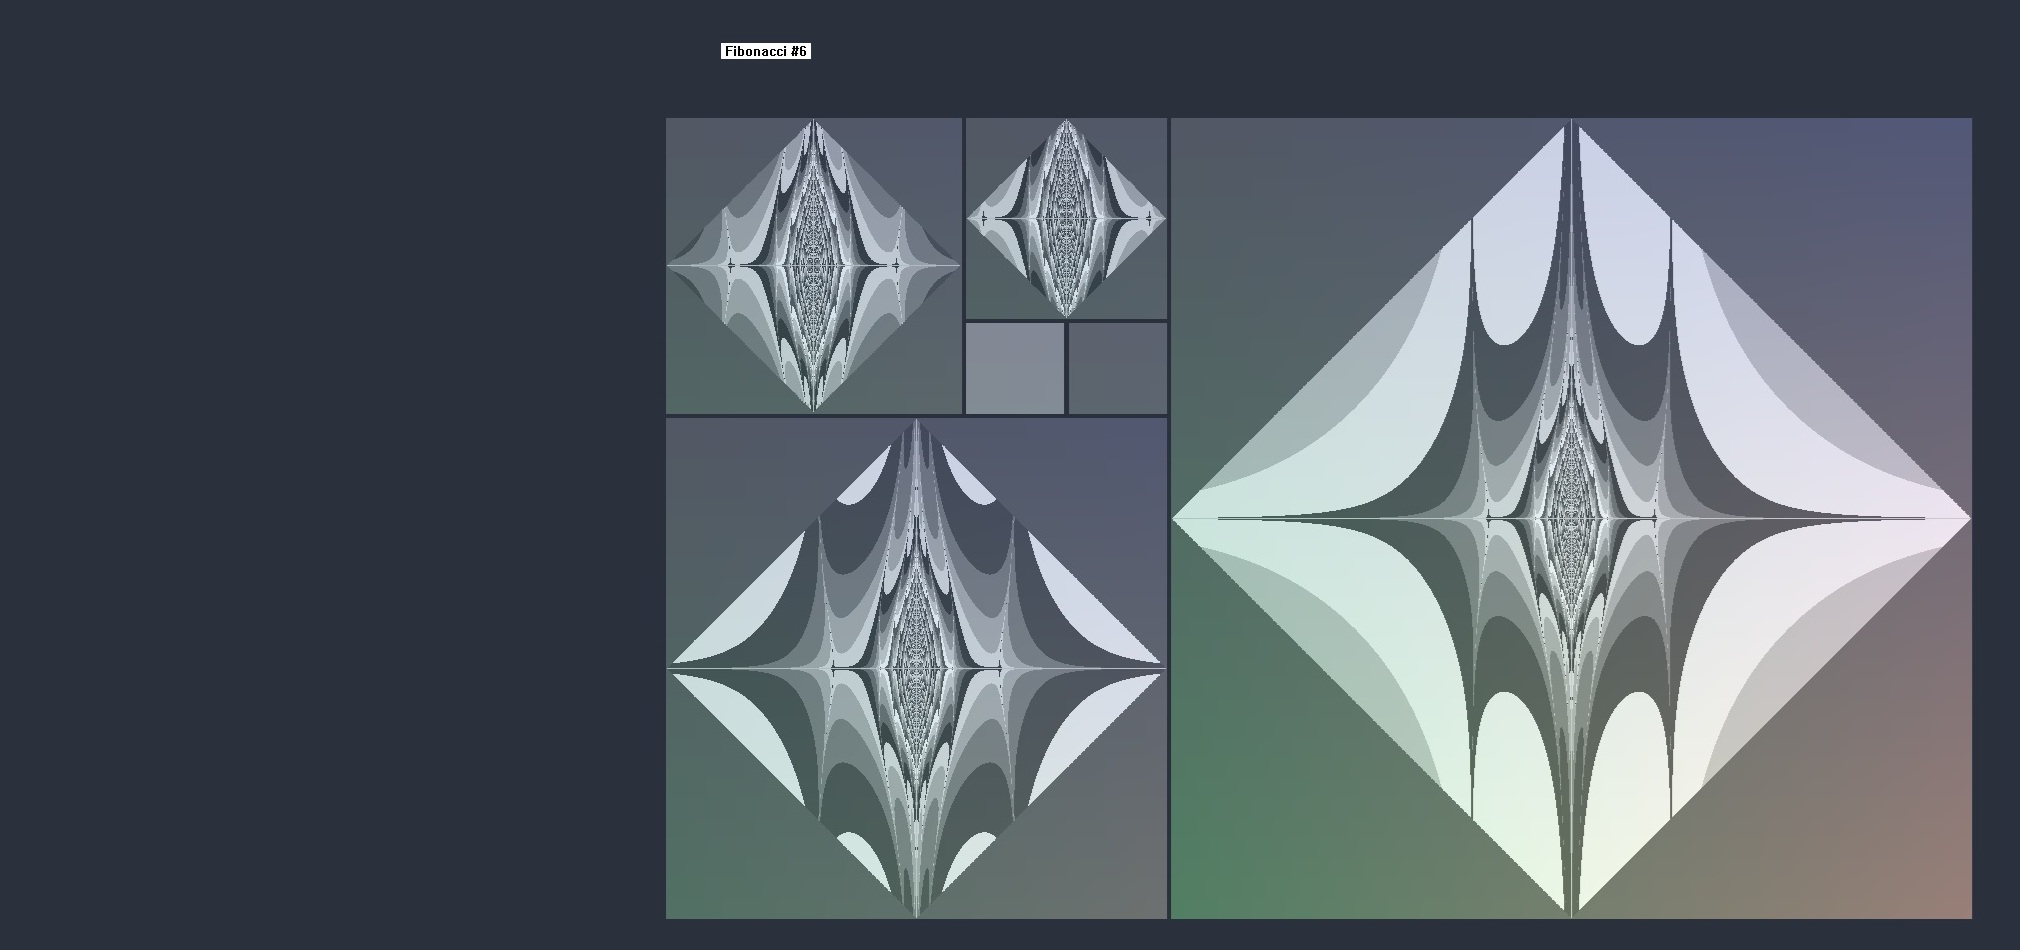
Fibonacci Spiral
A Fibonacci Spiral (Top Left Figure) and a modified Fibonacci Spiral (Top Right Figure) that includes horizontal lines, vertical lines, and colors are shown.
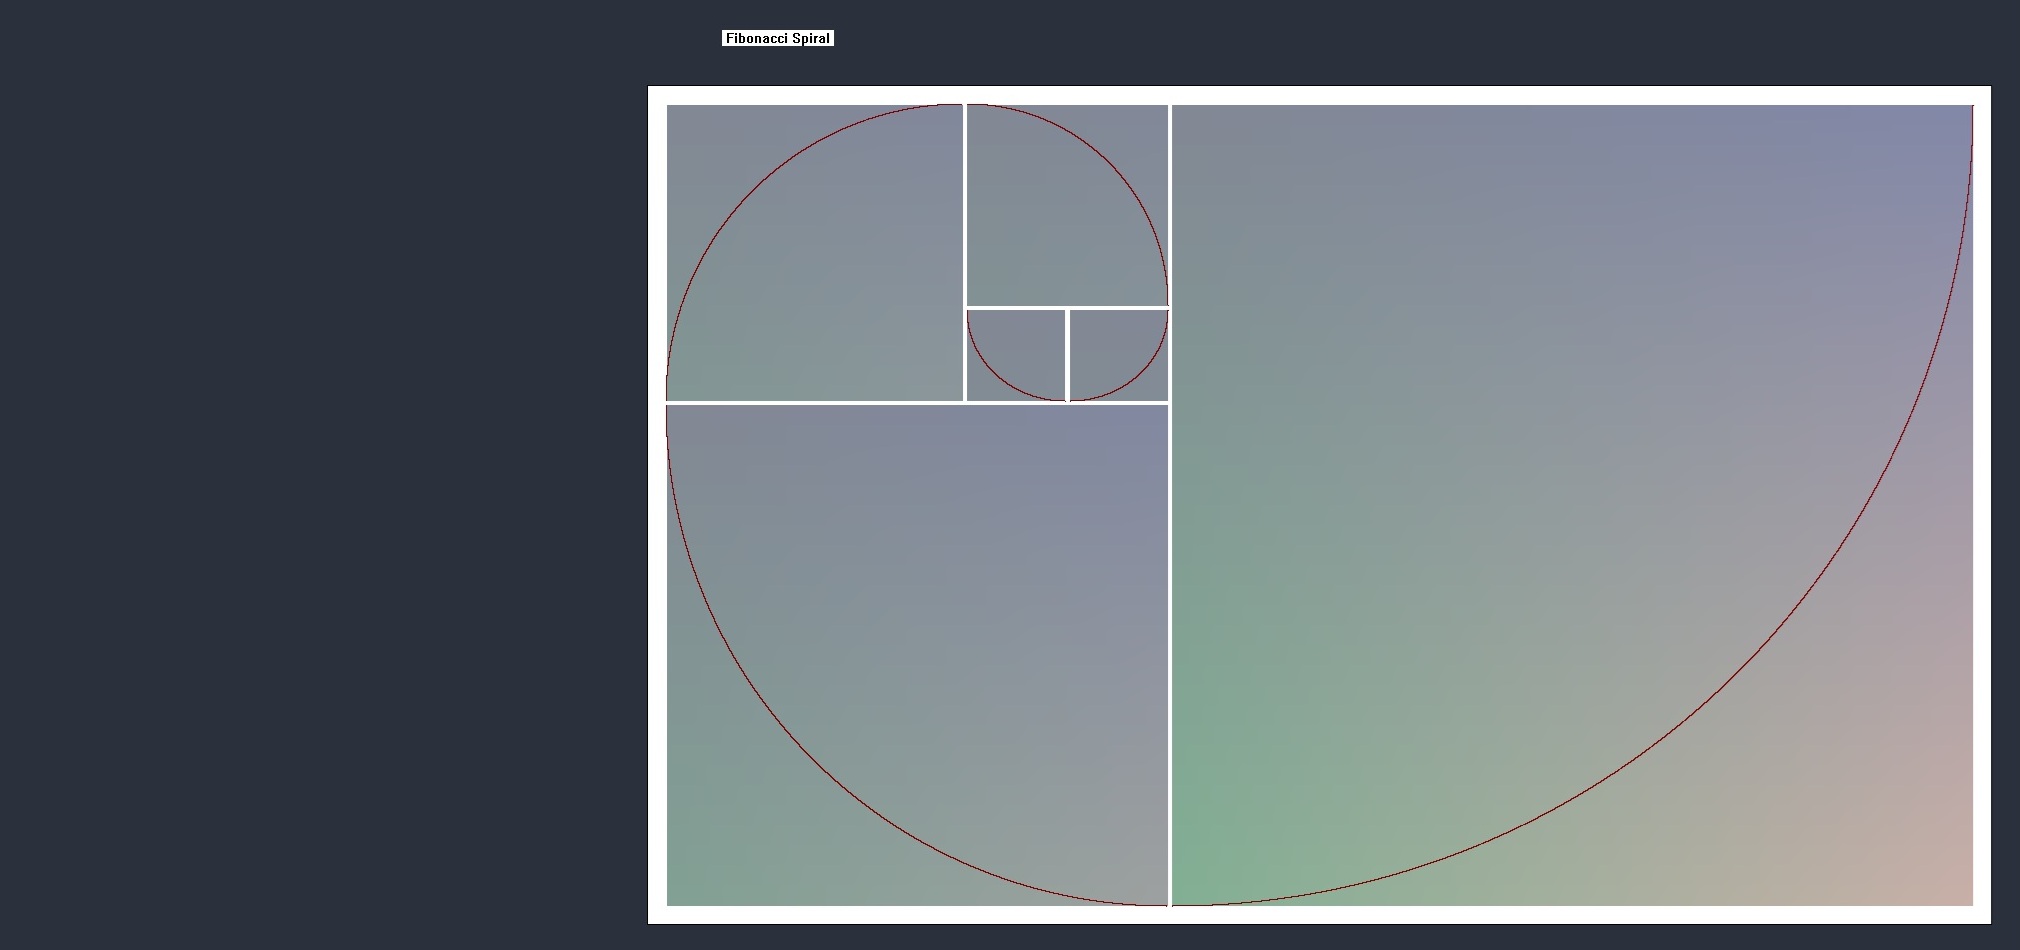
Below the starting examples are modified Fibonaci Spirals that include fractal figures.
Spirals are calculated using sin(θ), cos(θ) for each "square" quarter-circle.
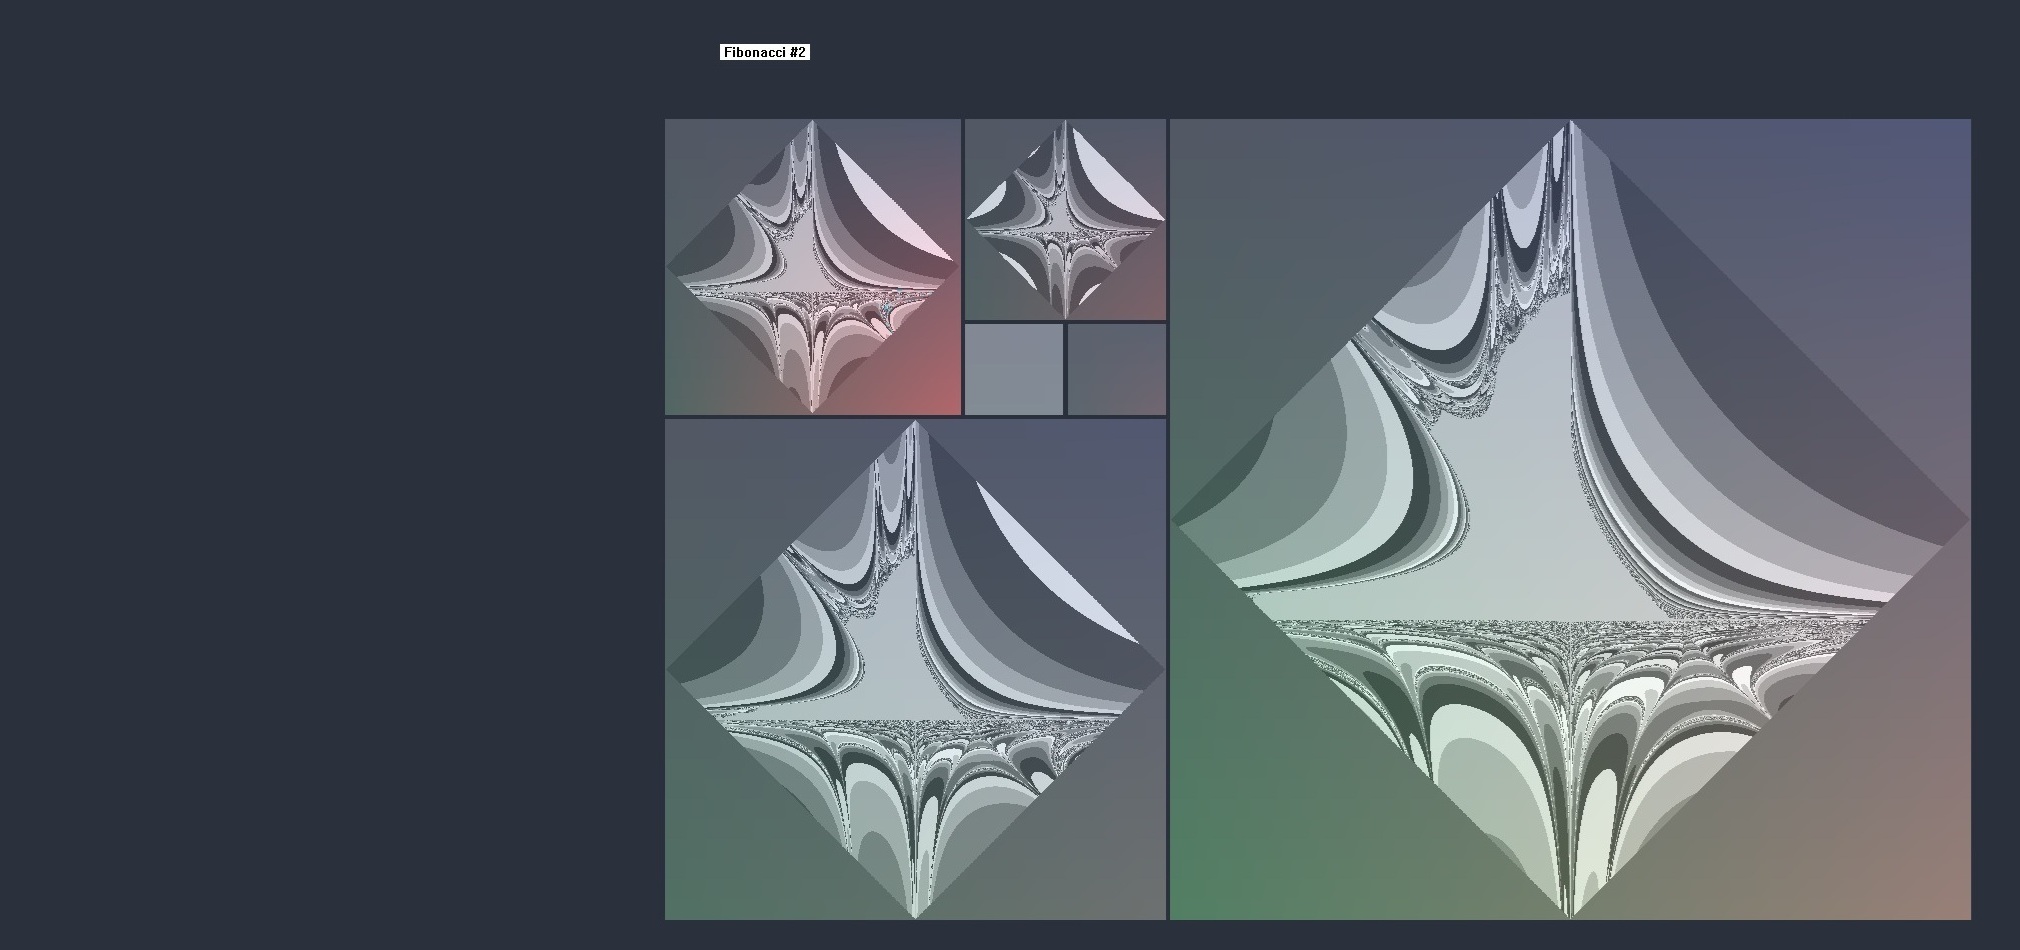
xoff[4] = { 100, 400, 500, 600 }, yoff[3] = { 500, 200, 400 };
for (i = 0; i ≤ 499; i++) for (j = 0; j ≤ 499; j++)
	Plot(i + xoff[0], j + yoff[0], light gray));
for (i = 0; i ≤ 799; i++) for (j = 0; j ≤ 799; j++)
	Plot(i + xoff[3], j + yoff[1], medium gray);
for (i = 0; i ≤ 299; i++) for (j = 0; j ≤ 299; j++)
	Plot(i + xoff[0], j + yoff[1], dark gray);
for (i = 0; i ≤ 199; i++) for (j = 0; j ≤ 199; j++)
	Plot(i + xoff[1], j + yoff[1], gray);
for (i = 0; i ≤ 99; i++) for (j = 0; j ≤ 99; j++)
{
	Plot(i + xoff[1], j + yoff[2], more gray);
	Plot(i + xoff[2], j + yoff[2], less gray);
}
for (0; 0 ≤ 90; 0++)
{
	x = cos(0);
	y = sin(0);
	Plot(x*800.0+xoff[3], y*800.0 + yoff[1], red);
	Plot(-x*500.0+xoff[3], y*500.0+yoff[0], red);
	Plot(-x*300.0+xoff[1], -y*300.0+yoff[0], red);
	Plot(x*200.0+xoff[1], -y*200.0+yoff[2], red);
	Plot(-x*100.0+xoff[2], y*100.0+yoff[2], red);
	Plot(x*100.0+xoff[2], y*100.0+yoff[2], red);
}
Modified Fibonacci Spiral (Top Right Figure)
xoff[4] = { 100, 400, 503, 605 }, yoff[3] = { 495, 195, 400 };
for (i = 0; i ≤ 500; i++) for (j = 0; j ≤ 500; j++)
	Plot(i + xoff[0], j + yoff[0], color);
for (i = 0; i ≤ 800; i++) for (j = 0; j ≤ 800; j++)
	Plot(i + xoff[3], j + yoff[1], color);
for (i = 0; i ≤ 295; i++) for (j = 0; j ≤ 295; j++)
	Plot(i + xoff[0], j + yoff[1], color);
for (i = 0; i ≤ 200; i++) for (j = 0; j ≤ 200; j++)
	Plot(i + xoff[1], j + yoff[1], color);
for (i = 0; i ≤ 97; i++) for (j = 0; j ≤ 90; j++)
{
	Plot(i + xoff[1], j + yoff[2], color);
	Plot(i + xoff[2], j + yoff[2], color);
}
for (0; 0 ≤ 90; 0++)
{
	x = cos(0);
	y = sin(0);
	Plot(x*801.0+xoff[3], y*801.0 + yoff[1], red);
	Plot(-x*501.0+xoff[3]-5, y*501.0 + yoff[0], red);
	Plot(-x*296.0+xoff[1]-5, -y*296.0 + yoff[0]-5,red);
	Plot(x*201.0+xoff[1], -y*201.0 + yoff[2]-5, red);
	Plot(-x*98.0+xoff[2]-5, y*91.0 + yoff[2], red);
	Plot(x*98.0+xoff[2], y*91.0 + yoff[2], red);
}
Resources for Fibonacci sequence information and Fibonacci spiral calculations:
https://en.wikipedia.org/wiki/Fibonacci_sequence
https://en.wikipedia.org/wiki/Golden_spiral